
I just stumbled upon a new favorite function in R, the possibility to upload HTML files directly via FTP from the console. This means that you can create a script, extracting and cleaning data, then plot the relevant information and push it to a live web page on your domain, i.e. you can create a live dashboard that gets updated with a scheduled R script as often as you want!
Creating an R Markdown file
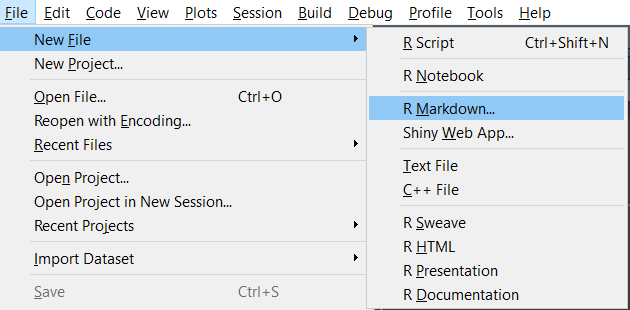
First off, you need to create an R Markdown file. If you're in RStudio, simply click on "New file" and choose "R Markdown".
Select HTML as document type and then you will get a template .Rmd-file. I'm just gonna show you my own code as it is and then explain what the different parts do. If you want more details on how R Markdown files works and what you can do, you can check out Yihui's guide.
---
title: "This is an example of rmarkdown with ftpUpload"
author: "Linus Larsson"
date: "2019-05-16"
output:
  html_document:
    includes:
       in_header: myheader.html
---

```{r setup, include=FALSE}
knitr::opts_chunk$set(echo = TRUE)

fileConn <- file("myheader.html")
writeLines('<!-- Global site tag (gtag.js) - Google Analytics --><script async src="https://www.googletagmanager.com/gtag/js?id=YOUR_GA_ID"></script><script>window.dataLayer = window.dataLayer || [];function gtag(){dataLayer.push(arguments);}gtag("js", new Date());gtag("config", "YOUR_GA_ID");</script>',
           fileConn)
close(fileConn)
```


```{r, echo=FALSE, message=FALSE,warning=FALSE}
library(ggplot2)
library(dplyr)

got <- read.csv("gameOfThrones.csv", stringsAsFactors = FALSE)

gotSeason <- group_by(got, season) %>%
  summarise(rating = round(mean(avgRating),1)) %>%
  as.data.frame()
```

## Game of Thrones - Average rating per season
```{r, echo=FALSE, message=FALSE}
ggplot(gotSeason, aes(x=season, y=rating)) +
    geom_line(size=0.9, color="red") +
    theme_bw() +
    theme(plot.background = element_rect(fill="lightblue")) +
    theme(panel.background = element_rect(fill = "lightblue")) +
    theme(panel.grid = element_line(colour = "white", linetype = "dotted")) +
    theme(panel.grid.major.x = element_line(linetype = 0))
```
The first part contains information about the file and will be printed out in the top of the HTML page. Notice that I am using a header file to implement Google Analytics. You could do this by using an HTML file in your project directory, or do it the same way I do, which is to create the file in the code. You can see how I do this in the section below the file information. In the third section I type in the code that will import and structure the data and in the fourth section I plot the data, using GGplot2. Looks pretty simple, right?
Now click on the "Knit" icon above the script file in RStudio or type in the following command in the console.
rmarkdown::render("fileName.Rmd")
Now, you will have a file in your project directory with the chosen file name and ending with ".html". This is the file we want to upload as a web page.
Uploading the file to your website
This is the easiest part. You only have to run one line of code to upload the HTML file to your website. Just make sure you have access to your FTP information. The things you need are username, password and ip/server name. then you can simply run the following code:
RCurl::ftpUpload("fileName.html", "ftp://USERNAME:PASSWORD@SERVER_NAME/domain.com/root/page")
There you go, hopefully this is enough to get you started with ftpUpload combined with R Markdown. Feel free to share ideas or results in the comments section below!
P.S. If you want to create slides with data you can look into ioslides.
Comments